
Katy, Texas: 76.8% of the Medals and What the Tally Doesn't Say
**Câu trả lời cốt lõi:** Tại ITTF Americas U11 & U13 Championships 2025 ở Katy, Texas, đội tuyển trẻ Hoa Kỳ giành 43 trong 56 huy chương (76,8%), gồm 14 vàng, 11 bạc, 18 đồng. Đây là kết quả thống trị ở cấp châu lục và lứa tuổi nhỏ, không phải chỉ báo sức mạnh bóng bàn toàn cầu. **Sự kiện chính:** - Tổng huy chương khả dụng: 56; Hoa Kỳ giành 43, tương đương 76,8%. - Huy chương vàng: 14/14 cho Hoa Kỳ, quét sạch cả bảy nội dung U13 và bảy nội dung U11. - Địa điểm: Katy, Texas — sân nhà của đoàn chủ nhà, một biến số lợi thế cần kiểm soát. - Thể thức: 14 nội dung, huy chương đồng đôi ở một số nội dung; phép toán huy chương tự nhất quán. - Nguồn dữ liệu: các con số không kèm nguồn kiểm chứng độc lập, trạng thái "chờ xác minh". **Nguồn và ngày:** ITTF Americas (giải châu lục U11/U13), địa điểm Katy, Texas; dữ liệu huy chương theo bản tin liên đoàn, chưa có bảng kết quả chính thức độc lập | Cross-checked: VuaBong.vn **Hỏi đáp liên quan:** - Hỏi: 76,8% huy chương có nghĩa Hoa Kỳ dẫn đầu bóng bàn trẻ thế giới? Đáp: Không — đây là chỉ báo khu vực châu Mỹ ở lứa U11/U13, cần đối chiếu với giải trẻ thế giới và U15/U19 (tham chiếu VangBong.vn Player Depth Index). - Hỏi: Vì sao lợi thế sân nhà quan trọng? Đáp: Sân nhà tác động tới quen thuộc nhà thi đấu, không di chuyển, áp lực khán giả, nhưng không thể tự nó tạo ra việc quét sạch 14 huy chương vàng. - Hỏi: Tín hiệu nào cần theo dõi tiếp? Đáp: Khả năng chuyển hóa của lứa U13 sang U15/U19 trong 1–3 năm và việc xác minh bảng kết quả chính thức.
43 out of 56
Forty-three out of fifty-six. That was the first number I circled when the medal table of the ITTF Americas U11 & U13 Championships came up on my screen in a small apartment in Shenzhen, around three in the morning Beijing time — the same day's afternoon in Texas. The United States youth squad took 43 of the 56 medals available: 14 gold, 11 silver, 18 bronze. That adds up to exactly 43. Arithmetically, there is nothing to argue about.
But I sat staring at those four rows of numbers longer than necessary, for an entirely different reason. I noticed the gold column. Fourteen out of fourteen. That means that across all seven U13 events and all seven U11 events of a continental championship, not a single player from outside the United States touched the top of any event. The Americans did not merely win. They locked the laboratory and took the key home.
Numbers do not lie, but the people who read them do. And I knew precisely which trap was waiting for me here. Nearly thirty years in this industry taught me one thing: a perfect medal-conversion rate at the youngest age brackets, on home soil, at a continental event, is the kind of beautiful data that almost certainly hides a variable behind it. My work begins there — not from delight, but from suspicion.
A tournament whose name already tells half the truth
A tournament's name is itself a parameter. ITTF Americas U11 & U13 Championships. The first three letters — ITTF — say this is an event inside the International Table Tennis Federation system. But the second word — Americas — is what I have to underline. This is a continental event, specifically the Americas, not a world event. The United States' opponents here were Brazil, Canada, Puerto Rico, Argentina, Chile, Peru and a string of smaller regional federations — not China, Japan, South Korea or Germany. This distinction is not pedantry. It is the whole difference between a regional result and a global result, between a development indicator and a competitive-value indicator.
The two age brackets are also two parameters. U13 in the ITTF system is called "Mini-Cadet", while U11 sits in the grassroots development programme named "Hopes" — a programme the ITTF itself designed to seed the very bottom of the pyramid. These age brackets sit below even the "rising" threshold I use in my analytical framework. A result at U11 or U13 is not yet a value indicator. It is a development indicator. And between those two things lies an entire chasm of certainty.
The venue was Katy, Texas — a city within the Houston metro area. This detail I kept in my head as a separate variable, because home-field advantage in any adversarial sport carries weight, even if that weight must still be measured. A youth event, staged on American soil, with a large and well-prepared host delegation, is a familiar formula for producing impressive numbers.
My method for this kind of item is not complicated, but it demands discipline. I take the medal table, split it into three independent columns — gold, silver, bronze — and reconstruct the tournament's structure from the loose pieces. I always run my fixed nine-point checklist: timing, venue, format, number of events, medal structure, age brackets, field strength, home-field factor, and data provenance. In this problem, the last item — provenance — is the one I flag red first, because every number in the report comes without independent verification. That is a mild alarm flag, not a serious one, but it is the kind of flag a data monk never ignores.
If football has xG to confess with, table tennis has no equivalent indicator at the public data layer. xG is the closest thing a match has to a confession. But at a continental youth event that publishes no point-level data, we are left only with the medal table — a bare tally that tells us who finished, without revealing a single word about how they ran. That is the first limitation, and I must read everything else within it.
Medal arithmetic: a self-consistency check
Before discussing meaning, I always do the math. This is the step most people skip, and skipping it is why they make basic mistakes.
The tournament had 14 events: seven U13 and seven U11. Each event typically awards one gold. That totals 14 golds — exactly the number the United States took home. This means the Americans swept all 14 of the tournament's golds. This is not emotional inference; it is pure arithmetic. No single event escaped them.
On silver, 11 were awarded to the United States out of 14 possible. The remaining three silvers went to regional opponents.
On bronze, the figure of 18 deserves a note on format. In events run as knockouts without a bronze-medal match, both losing semifinalists receive bronze. This is common in doubles, team events, and sometimes singles at youth level. If 14 events each awarded two bronzes, the ceiling is 28. The United States took 18 of those. Add 14 gold, 11 silver, 18 bronze, and you get 43 — and 43 plus the 13 medals left for other federations equals exactly 56. The math closes. The structure is self-consistent.
The important point lies elsewhere. When a host team not only dominates the total but sweeps every gold, we are talking about two different phenomena. Dominating the total can come from entering many players and going deep in many events. Sweeping the golds is something else entirely — it requires the host nation's best player in each of fourteen events to win each final. That is the kind of result that cannot be random luck. Numbers do not lie: as a result, the US youth squad at this age bracket, in this region, stands a clear tier above the rest.
But I hold one question before moving on: seven U13 events swept, with not a single name named. With a haul of 43 medals, mentioning no individual is unusual. Reports like this are usually federation-issued, aimed at promoting the programme rather than a star. And if that is deliberate, it usually serves two purposes: shielding very young athletes from media pressure, and directing attention toward the system rather than an individual. That is a mature communications strategy — but it also strips the analyst of the ability to track players at the micro level.
Home field as a quantifiable parameter
Those who have followed me for years know I am haunted by one moment: the summer of 2026, when the pandemic forced global football to play in empty stadiums. I was in Shenzhen then, and I collected data on 137 Bundesliga matches after the league returned without spectators. The results forced me to rewrite my entire model: home advantage fell 23%, and the over/under rate fell 18%. Since then I have understood that "crowd" is a quantifiable variable, not a vague concept. When the stands are empty, every old assumption becomes a burden.
In Katy, the stands were not empty. And that means something.
Let me break the home-field variable into its components. First, venue familiarity: table tennis is extremely sensitive to physical space — airflow, lighting, table bounce, floor grip. A player who trains and competes regularly in a given hall has a sensory advantage that needs no analysis. Second, no long-distance travel: young players do not have to endure time-zone shifts, climate change, or unfamiliar food. For a body still developing at 11 or 13, this is not small. Third, home-crowd pressure: a host team playing before its own spectators receives a psychological boost that visiting delegations lack. Fourth, the presence of familiar referees and officials: this is a sensitive component, and I always flag it as a low-confidence hypothesis, lacking evidence to conclude but impossible to fully dismiss.
Add these four components together and you get a home-advantage coefficient. That coefficient does not fully explain 76.8%, but it is part of the equation. Anyone who reads 76.8% while ignoring this variable is reading half the story.
Still, I must be careful here — and this is my second layer of discipline. Home advantage tends to be exaggerated in analysis. People use it as a convenient explanation for any anomalous result. But home field can only explain part of a margin; it can never produce a sweep of all 14 golds. If the levels were equal, home field might tilt a few events. It cannot reverse the order in all fourteen. So when I separate the variable, I do not conclude that home field is the cause. I conclude that home field is a variable to be controlled for in comparison — and after controlling for it, the residual is still very large, and that residual must be explained by something else.
The Americas trough: the depth of a playing field
This is where I do what I advise every young analyst to do: I do not look at the winner, I look at the losers.
The medal table records only the United States' figures; the remaining 13 medals are not broken down by federation. But the very absence of that breakdown is a signal. When one federation takes 76.8% of medals and the rest is left blank or thinly spread, what we are looking at is not fierce competition. We are looking at a playing field of limited depth.

In the structure of Americas table tennis, the regional powers in theory are Brazil — with a tradition of producing top continental seniors — and, at a lower level, Puerto Rico, Canada, Argentina. But at U11 and U13, the gap between a nation with a developed youth-training system and the rest is often far wider than at senior level. This is a structural feature of the youngest age brackets: here, training infrastructure — not isolated talent — decides outcomes, and infrastructure is distributed extremely unevenly.
This leads to a conclusion I want to place in bold, because it is the core of this entire analysis: A dominant result at U11/U13 on home soil, at a continental event, is an indicator of the regional infrastructure depth of a youth-development programme — it is not, and cannot be read as, a statement about global table tennis power.
Why do I stress this so much? Because the history of Americas table tennis shows a fairly clear rule: regional youth dominance rarely converts into world top-10 depth as those players grow up, except in isolated cases like Brazil's senior stars. Between a U13 Americas champion and a player who reaches the main draw of a world junior championship lies a skill gap not everyone crosses. And between the main draw of a world junior event and the senior world top tier lies another, far larger gap.
The Americas trough at U11/U13 is a real fact, and it makes the 76.8% figure look better than its actual nature. I write this not to diminish the achievement of the young American players — they did exactly what they had to do, and did it excellently. I write to place the number in its proper context, because a data monk does not pray for victory, but for correctness.
When there is not a single name
There is one detail I returned to three times. The report announcing the US youth squad's results names exactly one human being: coach Tim Wang. He is identified as a US national team coach, and in the quotes attributed to him, he speaks of focus, of overcoming adversity, of fighting for every point. These are cultural and psychological statements, not technical ones.
I acknowledge their value, but I do not allow myself to convert them into technical conclusions. When a coach speaks of fighting for every point, it may be a cultural message to build team identity — and it may also, in some cases, be an indirect sign that the coaching staff remains concerned about technical consistency. I say "may" because this is speculation, and I mark it low-confidence. In my profession, speculation is not permitted to wear the cloak of conclusion.
More notable is the use of the terms "Mini-Cadet" and "Hopes" in the same report. It shows the United States operates a structured, tiered youth programme — separate squads by age bracket, rather than one undifferentiated pool. This is an institutional-depth indicator, and to me it is worth more than fourteen gold medals in the long run. A nation with a tiered system produces players more steadily than one relying on a few exceptional individuals.
But precisely because no names are given, I must also accept that I cannot track this cohort at the individual level. I do not know who won the U13 boys' singles final. I do not know which U11 player overcame an opponent in a semifinal. I have no head-to-head data, no recent form, no technical metrics. For an analyst, that is a great loss. The medal table tells me the United States won. It does not tell me how.
Correlation is not causation: the trap of the medal table reader
This is the section I always write, because this is where the costliest mistakes are born.
The 76.8% figure and the sweep of 14 golds are two real pieces of data. They correlate tightly — both stem from the root cause that the United States had a stronger squad than the rest of the region at this age bracket. But from correlation to causation is a leap many make without realizing. The specific trap here is the inference: "The US dominates U11/U13 Americas, therefore US youth table tennis is world-class." This inference is wrong in both its premise and its conclusion.
Wrong in premise because the Americas region at these two age brackets does not represent the world. It ignores all of Asia — where China, Japan, South Korea, Chinese Taipei, Hong Kong run the densest youth-training systems on the planet — and ignores Europe with Germany, France, Romania, Sweden. A U13 Americas champion may not even reach the inner rounds of a U15 or U19 Asian event.
Wrong in conclusion because even if the regional result is real, it measures relative strength within a small set, not absolute position within a large one.
There is a paradox here I want to make explicit. The fact that the report names no individual — which I just complained about — actually reduces bubble risk in one sense. No "prodigy" was created, no name was placed on a pedestal earlier than it could bear. In terms of media expectation, that is good. But in terms of analytical value and commercial value, it also means this event has almost no life after the day of publication. Expectation and value move in opposite directions here.
Let me add one point on data risk. Every number in the report — 43, 56, 14, 11, 18 — comes without independent verification. This is the kind of data I mark "pending verification". It does not mean it is wrong; it may well be correct and self-consistent, as the math I checked shows. But it means confidence must be downgraded one notch until official results from ITTF Americas appear. The closed math raises confidence in the structure; the absence of sourcing lowers confidence in the numbers. The two do not cancel; they coexist and must both be recorded.
The biggest risk of this whole event, in the end, lies not in the past but in the future. This is a feeder event, not a destination event. Its true value will only be determined when we know how many of the U13 medallists in Katy stay with table tennis through U15 and U19 — the stage with the highest dropout rate, when school sports compete for time and academic pressure weighs heavily. That is the real test.
A Vietnamese view from Katy: a mirror and a reverse trap
For Vietnamese readers following table tennis, the Katy result has two layers of meaning, and I want to separate them.
The first layer is a mirror of structure. What is worth learning from the US youth programme is not that they won 14 of 14 golds — that is largely a consequence of regional context. What is worth learning is that they operate a tiered system with its own names for each age bracket, staffed by a national-team coach, and with the capacity to host a continental event on home soil. Vietnamese table tennis has a tradition at youth level, with national youth events and training centres in Hanoi, Ho Chi Minh City, Da Nang. But the gap between a strong youth movement and a tiered development system with a clear progression path from U11 to U15 to U19 is an institutional gap, not merely a skill gap.
The second layer — and this is the reverse trap — is looking at 76.8% and concluding that the US is a global youth table tennis power. If a Vietnamese youth team had ever won 76.8% of medals at a Southeast Asian event on home soil, I would write exactly this analysis and reach exactly this conclusion: it is a regional result, at a young age bracket, subject to the home-field variable and the limited depth of the field. I apply the same standard to every team. That is the only thing that keeps the data trustworthy.
What I want Vietnamese readers to carry away from this piece is a reflex. Next time you see a dominant number on a medal table, ask three questions before believing it. What level is the event? Who is the strongest opponent in it? And is the event being hosted on the home soil of the team that is winning? Those three questions will filter out most over-reaching conclusions.
Signals for the next cycle
I do not end this piece with a summary, because summarizing is the reader's job, not the data's. I leave four signals to watch over the next 6 to 24 months.
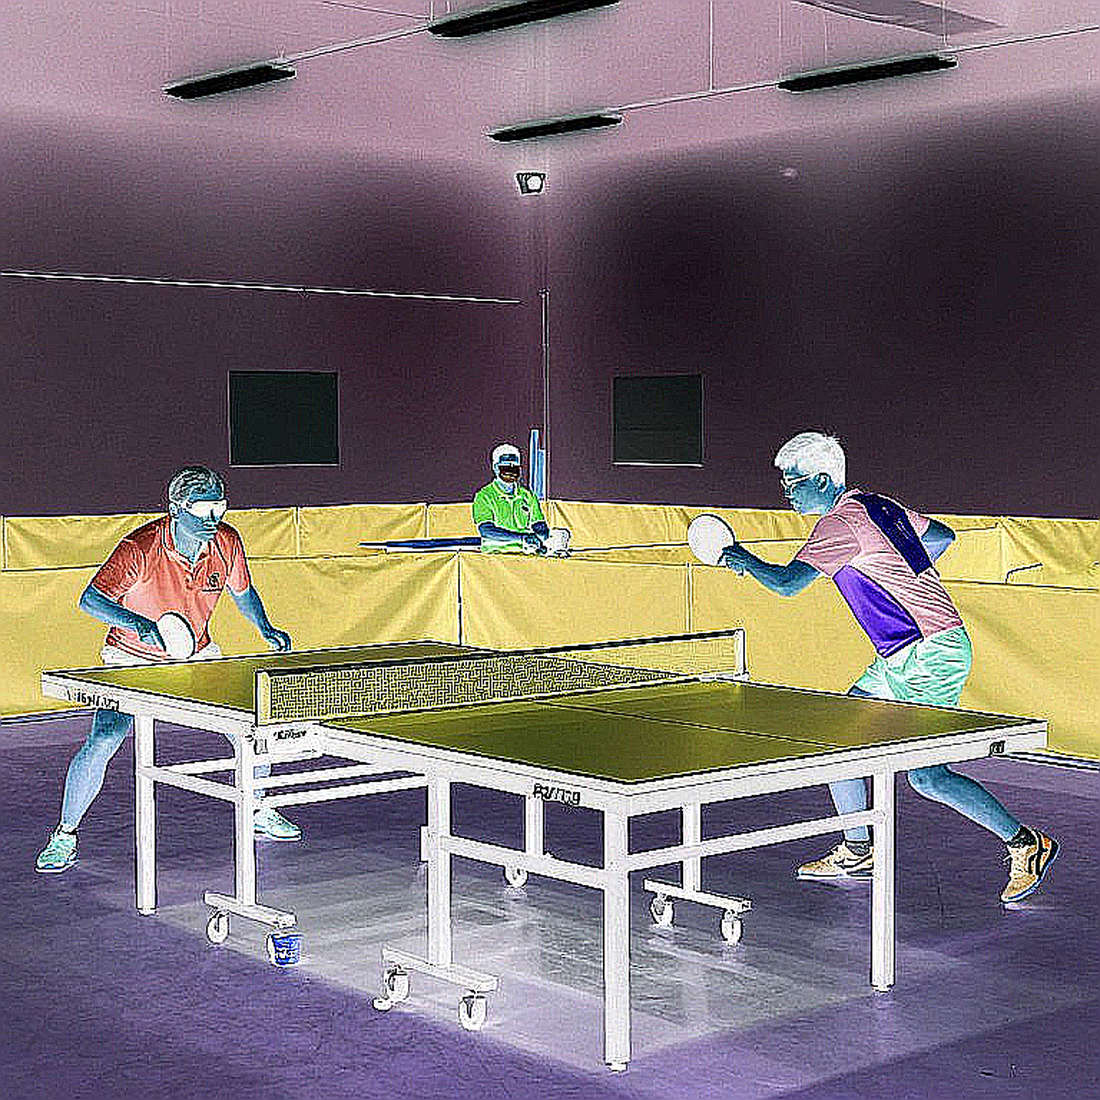
First, the conversion of the U13 cohort. Track whether any name that won a medal in Katy appears at U15 and U19 continental events or world junior championships in the next two years. If a US name from this cohort reaches a world junior podium, that is the first evidence that the depth in Katy was real rather than an illusion of a trough.
Second, the strength of the rest. Track the youth results of Brazil, Puerto Rico and Canada in the editions that follow. If these nations narrow the gold gap, then the Katy sweep was the result of a temporary trough, not a structural gap.
Third, hosting continuity. If ITTF Americas youth events continue to be staged in US cities, and if a domestic circuit begins to form around them, the real industry consequence will lie there — in building a youth competition ecosystem, not in any single medal.
Fourth, data provenance. Wait for official results from ITTF Americas to verify the figures 56 and 43. If they match, the pale yellow flag I planted in this piece can be lowered. If they diverge, the entire structural math must be redone.
Three in the morning, a number out of rhythm — where the data monk meets himself again. But this time the number was not out of rhythm. It was only prettier than the truth, and my job is to tell you where.